
Background

Essential Evidence-Based Background Information
Meta-analysis
is a statistical technique combining the results of multiple studies on the same topic, to develop an average effect-size. It is used to synthesize findings from many studies to draw more accurate conclusions about the effectiveness of a particular educational approach, strategy, or intervention. It’s powerful tool for researchers, policy makers, and educators as it is easier to make informed decisions on effectiveness from evidence that has been gathered from multiple sources rather than one source.
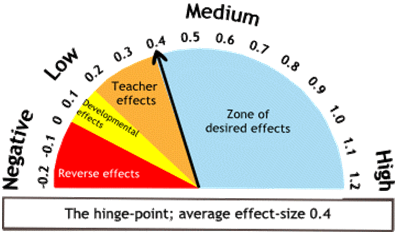
Effect size
is a measure of the magnitude of differences between two groups (experimental and control group). It is used to quantify the impact of the “treatment effect” of the approach, strategy, or intervention on the subjects. It is a way to determine “if the treatment works.”John Hattie and his associates created the Hinge-Point Graph to illustrate visually the range and impact of the Effect-Size score. Note the “Hinge Point” is 0.4 which represents “one-years- growth in one-years-time.” Hattie, J. (2023). Visible learning: The sequel. Routledge press.
Marzano Conversion Table
Robert Marzano has converted the effect-size statistic into an achievement percentile gain to better understand meta-analysis data. For example, an effect-size of 1.28 is the same as a student percentile achievement gain of 40%. This means that if the teacher in classroom A used the strategy and the teacher in classroom B with a similar paired group of students (control group) did not use the strategy, what is the difference? In this case it was 1.28 effect size for the students in classroom A. In achievement % that equates to a difference of 40%. This means that the students in classroom A outperformed students in classroom B by 40%.
Marzano, R., Pickering, D., Pollock, J. (2001). Classroom instruction that works: Research-based strategies for increasing student achievement. ASCD, Alexandria VA. pg.160.
Marzano Conversion Table: Effect-Size to Achievement Percentile Gain
| Highest Impact | Dramatically Boosts Achievement % |
|---|---|
| 1.56 | 44 |
| 1.48 | 43 |
| 1.41 | 42 |
| 1.34 | 41 |
| 1.28 | 40 |
| 1.23 | 39 |
| 1.18 | 38 |
| 1.13 | 37 |
| 1.08 | 36 |
| 1.04 | 35 |
| 1.00 | 34 |
| 0.95 | 33 |
| 0.92 | 32 |
| 0.88 | 31 |
| 0.84 | 30 |
| 0.81 | 29 |
| Accelerated Impact | Boosts Achievement % |
|---|---|
| 0.77 | 28 |
| 0.74 | 27 |
| 0.71 | 26 |
| 0.67 | 25 |
| 0.64 | 24 |
| 0.61 | 23 |
| 0.58 | 22 |
| 0.55 | 21 |
| 0.52 | 20 |
| 0.50 | 19 |
| 0.47 | 18 |
| 0.44 | 17 |
| 0.41 Average Teacher Impact | 16 |
| 0.39 | 15 |
| Potential Impact | Possible Achievement Boost % |
|---|---|
| 0.36 | 14 |
| 0.33 | 13 |
| 0.31 | 12 |
| 0.28 | 11 |
| 0.25 | 10 |
| 0.23 | 9 |
| 0.20 | 8 |
| Minimal Impact | Low Achievement % |
|---|---|
| 0.18 | 7 |
| 0.15 | 6 |
| 0.13 | 5 |
| 0.10 | 4 |
| 0.08 | 3 |
| 0.05 | 2 |
| 0.02 | 1 |
| 0.00 | 0 |
| Negative Impact | Negative impact on Achievement % |
|---|---|
| -0.02 | -1 |
| -0.08 | -3 |
| -0.10 | -4 |
| -0.13 | -5 |
| -0.15 | -6 |
| -0.20 | -8 |
| -0.25 | -10 |
| -0.31 | -12 |
| -0.36 | -14 |
| -0.41 | -16 |
| -0.47 | -18 |
| -0.50 | -19 |
| -0.52 | -20 |
| -0.55 | -21 |
| -0.58 | -22 |
| -0.61 | -23 |
| -0.67 | -25 |
| -0.71 | -26 |
| -0.77 | -28 |
| -0.84 | -30 |
| -0.92 | -32 |